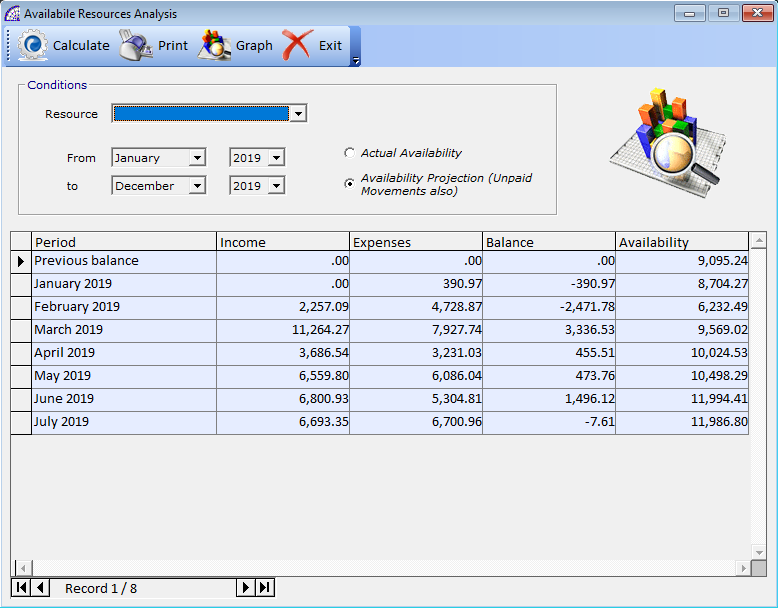
We enter the important part of the management of corporate finance, that is the possibility to extract data analytically and graphically in order to quickly understand the economic and financial situation. From this management it is possible to extract the cash availability, by period and by value, in relation to the real treasury movements and the imported forecast flows present in the archives.
In the “Conditions” tab of this window it is possible to define the filter parameters to extract the relevant data, relative to the single resource (bank), to the reference period and/or for real movements created by accounting (“Actual Availability”) or even for movements related to imported flows (“Availability Projection”).
The result obtained after pressing the calculation button, will be present in the grid below where the data for each month are displayed in terms of “Income”, “Expenses”, “Balance” and “Availability”.
By pressing the “Print” button in the toolbar above, the program displays a window with the same data represented in a graphic and analytical way.
The graphical representation displays the data in the grid of the previous window, starting from the current position in the cursor grid. In this graphical representation there is a toolbar that allows you to change the view.
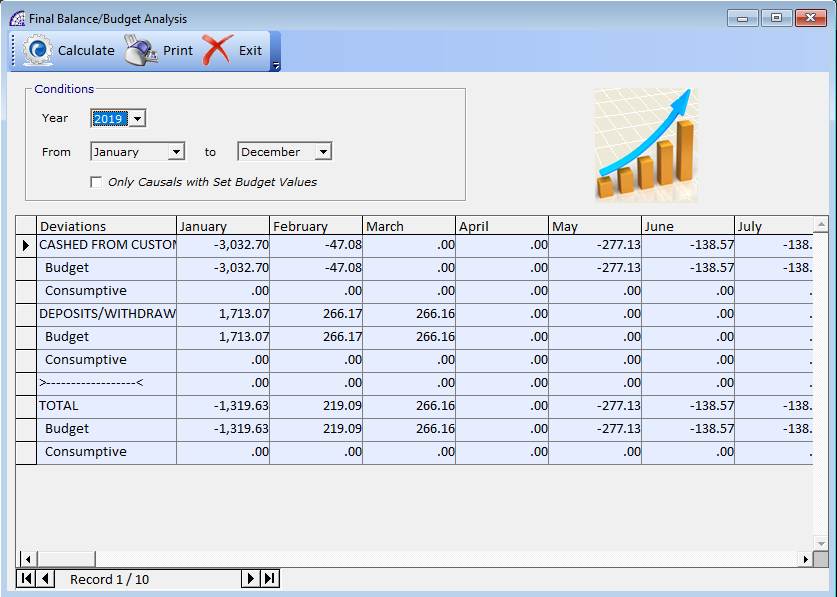
ANALYSIS -> BALANCE/BUDGET FINAL
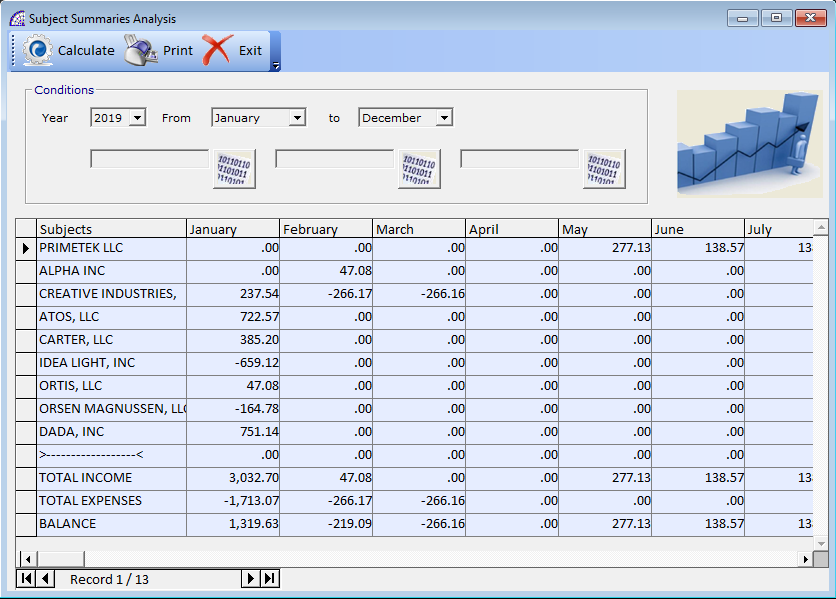
ANALYSIS -> SUBJECT SUMMARIES
This analysis displays the list of customers and suppliers present in the various treasury movements, for each month it reports the total. In the case of suppliers, therefore costs, the value will be negative. In the grid below, after reporting the various nominatives, displays the total values by month, of income, expenses and final balance.
In the “Conditions” tab of this window it is possible to define the filter parameters to extract the relevant data, relative to the reference year, from month to month, by causal, by classification, nominative (customer or supplier).
After changing the filter conditions, to calculate the values press the button on the window toolbar.
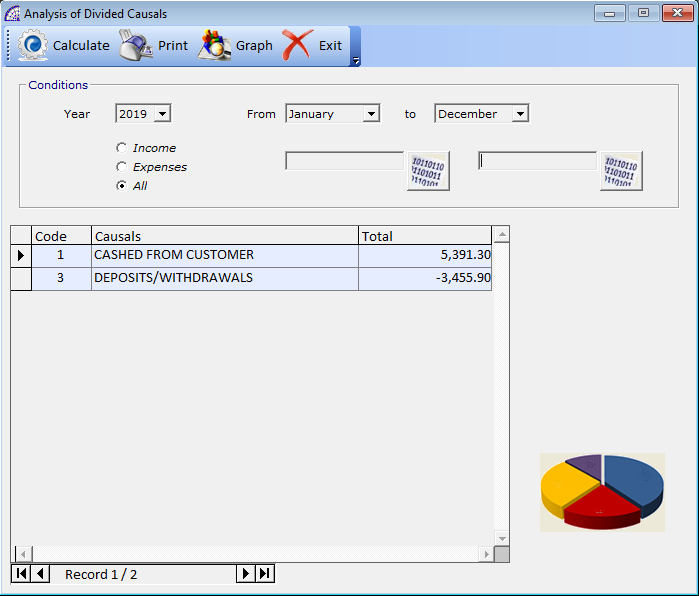
ANALYSIS -> CAUSAL BREAKDOWNS
This analysis displays the total values for a single causal used in treasury movements. In the “Conditions” tab of this window it is possible to define the filter parameters to extract the relevant data, relative to the competence year, from month to month, for income or expenses or all, by classification, by nominative (customer or supplier).
By pressing the button in the toolbar the program recalculates the values, resets the data in the grid below and reports the new data.
By pressing the button on the toolbar the program displays a window that contains the graphically and analytically data. In this graphical representation there is a toolbar that allows you to change the view.
VARIOUS PRINTS
In all cases where customized printouts are required, which are not available among those available, the program provides a tool to connect external printouts and transfer all of the parameters necessary for their execution. However, the creation of external printouts requires good knowledge of the Object Crystal Report(R) tool, necessary for the creation of the same. In these cases, we advise you to contact qualified personnel.